
Introduction
What is a candlestick? If you have ever opened a crypto trading platform and stared at a screen full of colorful bars going up and down, you were looking at a candlestick chart. It can look confusing at first — almost like a random pattern with no clear meaning. But here is the truth: every single candle on that chart is telling you a precise story about what buyers and sellers did during a specific period of time.
Candlestick charts are one of the oldest tools in financial analysis. They were invented in Japan in the 18th century by a rice trader named Munehisa Homma, who used them to track market prices and predict future movements. Centuries later, traders all over the world still rely on the same visual system — now applied to stocks, forex, and of course, cryptocurrency.
The reason candlesticks have survived for over 300 years is simple: they work. In a single glance, a candlestick gives you four critical pieces of information — the opening price, the closing price, the highest price, and the lowest price reached during a given timeframe. No other chart type packs that much data into such a compact visual format.
In this guide, you will learn exactly what a candlestick is, how to read each part of it, what the colors mean, and how beginners can start using candlestick charts to better understand the crypto market. No trading experience required. By the end of this article, you will look at a candlestick chart and immediately understand what it is saying.
Let’s start from the very beginning.
What Is a Candlestick?
A candlestick is a type of price chart used in financial markets to display the price movement of an asset — such as Bitcoin, Ethereum, or any other cryptocurrency — during a specific period of time. That period can be one minute, one hour, one day, one week, or any other timeframe that a trader chooses to analyze.
Each candlestick represents exactly one unit of time. If you are looking at a daily chart, each candle represents one full day of trading activity. If you are looking at a 4-hour chart, each candle represents four hours. The chart is built by placing these candles side by side, from left to right, creating a visual timeline of price history.
The name “candlestick” comes from the shape itself. When you look at one, it genuinely resembles a candle: a rectangular body in the center with thin lines — called wicks or shadows — extending from the top and bottom, just like a flame above and a melted drip below.
Here is what makes a candlestick so powerful compared to a simple line chart: a line chart only shows you one data point per period, usually the closing price. A candlestick shows you four data points at once: the opening price, the closing price, the highest price reached, and the lowest price reached. This gives you a much richer picture of market behavior in that period.
For cryptocurrency traders, candlestick charts are the standard tool. Whether you are watching Bitcoin on a 15-minute chart or analyzing Ethereum over six months, you will be looking at candlesticks. Learning to read them is the single most important skill for anyone who wants to understand crypto price charts.
The Anatomy of a Candlestick
Every candlestick has the same basic structure. Understanding each part is essential before you start reading patterns or making any sense of a chart.
The Body
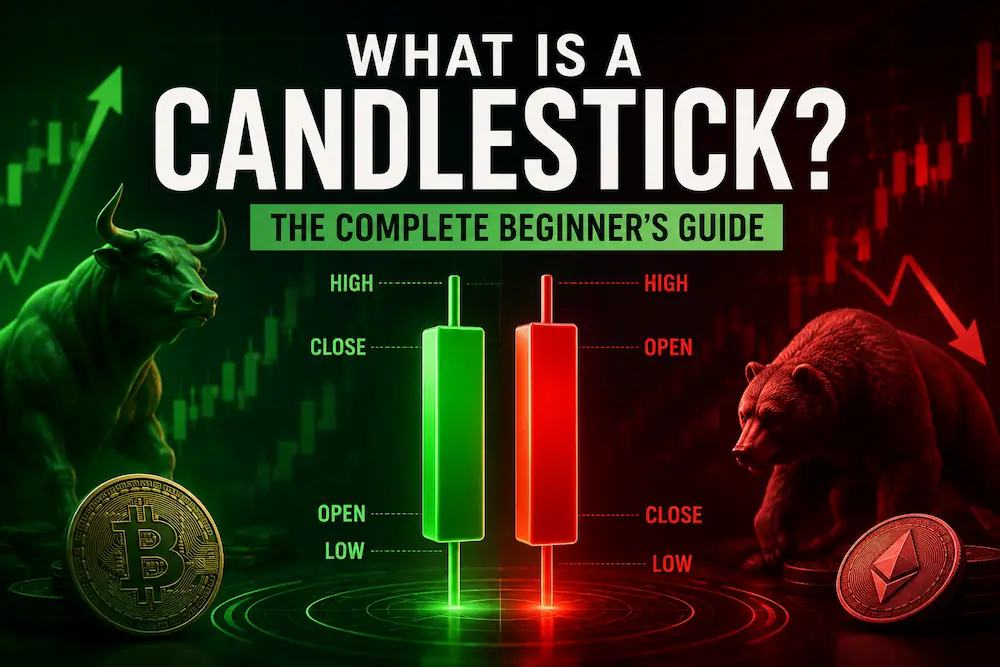
The body is the wide rectangular section in the center of the candlestick. It represents the range between the opening price and the closing price of the asset during that period.
- If the closing price is higher than the opening price, the body is typically shown in green (or white in some platforms). This means the price went up during that period — it is called a bullish candle.
- If the closing price is lower than the opening price, the body is typically shown in red (or black). This means the price went down — it is called a bearish candle.
The size of the body matters a great deal. A long body means there was a strong price movement in one direction — buyers or sellers were clearly in control. A short body means there was little price change, suggesting indecision in the market.
The Wicks (Shadows)
The thin lines extending above and below the body are called wicks, also known as shadows or tails. They show the highest and lowest prices reached during that period, beyond what the opening and closing prices were.
- The upper wick shows how high the price went before coming back down.
- The lower wick shows how low the price dropped before recovering.
Long wicks are significant signals. A long upper wick tells you that buyers pushed the price up, but sellers came in and pushed it back down before the period closed. A long lower wick tells you sellers pushed the price down, but buyers stepped in and drove it back up.
Colors: Green vs Red
While green and red are the most common colors used on crypto platforms like Binance or Coinbase, some platforms use white and black, or allow you to customize the colors. The logic is always the same: one color for up, one color for down. Always check your platform’s settings if you are unsure which is which.
How to Read a Candlestick
Now that you know the parts, let’s put them together and learn how to actually read what a candle is telling you.
Bullish vs Bearish Candles
A bullish candle means buyers won that period. The price started at a certain level (the open), dropped or stayed flat, then climbed higher and closed above where it started. When you see a tall green candle with a small wick, it means buyers were strongly in control the whole time — almost no hesitation.
A bearish candle means sellers won that period. The price opened at a level, attempted to rise or stayed flat, then fell and closed below the open. A tall red candle with a small wick means sellers dominated from start to finish.
What the Body Size Tells You
- Long body = strong momentum. A long green body = strong buying pressure. A long red body = strong selling pressure.
- Short body = weak momentum or indecision. Neither buyers nor sellers could move the price significantly.
- Very short body (almost no body) = this is called a Doji candle, and it signals extreme indecision. It often appears before a trend reversal.
What the Wicks Tell You
Wicks reveal rejected prices. If a candle has a very long upper wick, it means the price tried to go high, but the market rejected that high price and pulled it back down. That is a bearish signal — sellers are fighting back.
If a candle has a very long lower wick (sometimes called a “hammer”), the price tried to fall, but buyers stepped in and drove it back up. That is a bullish signal — buyers are defending a price level.
Why Candlestick Charts Are Used in Crypto
Cryptocurrency markets operate 24 hours a day, 7 days a week, with no breaks. This constant activity makes candlestick charts especially useful for crypto traders, for several reasons.
First, candlesticks display emotional information. Every candle is a snapshot of the battle between fear and greed in the market. A long red candle after a period of highs tells you that fear is entering the market — people are selling. A series of green candles with increasing body sizes tells you confidence is building.
Second, candlestick patterns are universal. Because crypto is a global market with participants from every country and timezone, the patterns that emerge on a Bitcoin chart in Japan are the same patterns that traders in Brazil, the United States, or Germany recognize. The visual language of candlesticks crosses all language barriers.
Third, crypto markets can be highly volatile. Prices can move 10%, 20%, or even 50% in a single day. Candlestick charts let traders quickly assess the speed and strength of those moves, helping them make more informed decisions about when to enter or exit a position.
Finally, candlestick charts work on every timeframe. A beginner might look at a daily chart to understand the big picture. A more active trader might use a 1-hour chart. The same principles apply regardless of the timeframe you choose.
Common Candlestick Patterns for Beginners
Once you can read individual candles, the next step is recognizing patterns — combinations of candles that tend to signal what might happen next. Here are the most important ones to know as a beginner.
Single Candle Patterns
Doji — The opening and closing price are almost exactly the same, creating a very small or invisible body. The candle looks like a cross. It signals indecision and often appears before a reversal.
Hammer — A candle with a very small body at the top and a long lower wick (at least twice the size of the body). It appears after a downtrend and signals that buyers may be stepping in. It is one of the most reliable bullish reversal signals.
Shooting Star — The opposite of the hammer. Small body at the bottom, long upper wick. Appears after an uptrend and signals that sellers may be taking control. It is a bearish reversal signal.
Marubozu — A candle with no wicks at all — just a long solid body. A green Marubozu means buyers were in complete control the entire period. A red Marubozu means sellers dominated completely.
Two Candle Patterns
Bullish Engulfing — A small red candle followed by a larger green candle whose body completely “engulfs” the first one. Strong signal that buyers have taken over.
Bearish Engulfing — A small green candle followed by a larger red candle that engulfs it. Strong signal that sellers have taken over.
Each of these patterns will be covered in detail in separate articles in this guide. For now, the important thing is to know they exist and that the shape of individual candles — and how they relate to each other — carries real meaning.
Candlestick vs Bar Chart vs Line Chart
You may come across other chart types when using crypto platforms. Here is how they compare:
Line chart — the simplest type. It connects closing prices with a single line. Easy to read but gives you very limited information. Good for a quick overview of a long-term trend, but not useful for detailed analysis.
Bar chart (OHLC chart) — shows the same four data points as a candlestick (open, high, low, close) but in a different visual format: a vertical line with small horizontal ticks on each side. It contains the same information as a candlestick but is harder to read quickly.
Candlestick chart — the best of both worlds. Visually clear, information-rich, and universally used by traders worldwide. The color coding makes it immediately obvious whether a period was bullish or bearish without having to calculate anything.
For cryptocurrency analysis, candlestick charts are the professional standard. Almost every serious crypto trader and analyst uses them, and all major platforms — including Binance, Coinbase, Kraken, and TradingView — display candlestick charts by default.
Frequently Asked Questions (FAQ)
1. What is a candlestick in crypto? A candlestick in crypto is a visual representation of price movement during a specific time period. It shows four prices at once: the open, close, high, and low. Green candles mean the price went up; red candles mean it went down.
2. How do I read a candlestick chart? Look at the body first (the rectangle). If it is green, the price closed higher than it opened. If it is red, it closed lower. Then look at the wicks: long upper wicks signal rejection of high prices; long lower wicks signal rejection of low prices.
3. What do the colors on a candlestick mean? Green (or white) means the price increased during that period — buyers were in control. Red (or black) means the price decreased — sellers were in control. Some platforms let you customize the colors.
4. What is a bullish candlestick? A bullish candlestick is a green candle where the closing price is higher than the opening price. It shows that buyers pushed the price up during that period. A large green body with small wicks indicates strong buying pressure.
5. What is a bearish candlestick? A bearish candlestick is a red candle where the closing price is lower than the opening price. It shows that sellers pushed the price down during that period. A large red body with small wicks indicates strong selling pressure.
6. What is the wick (shadow) on a candlestick? The wick, also called a shadow or tail, is the thin line extending above or below the candle body. The upper wick shows the highest price reached during the period. The lower wick shows the lowest price reached. Long wicks indicate price rejection at those levels.
7. What is a Doji candlestick? A Doji is a candlestick where the opening and closing prices are almost equal, creating a very small or invisible body. It looks like a cross or plus sign and signals market indecision. Doji candles often appear before trend reversals.
8. What timeframe should a beginner use for candlestick analysis? Beginners should start with the daily chart (each candle = 1 day). It filters out short-term noise and gives a clearer view of the overall trend. Once comfortable, you can explore the 4-hour or 1-hour charts for more detail.
Conclusion
Candlesticks are the foundational language of crypto charts. Once you understand what each part of a candle represents — the body, the wicks, the colors — you stop seeing a confusing screen of bars and start seeing a story: who is in control, where the market is hesitating, and where price has been rejected.
You do not need to be a professional trader to benefit from this knowledge. Even as a beginner, understanding candlesticks helps you make more sense of crypto news and market movements. When someone says “Bitcoin formed a hammer at support,” you will know exactly what that means and why it matters.
The next step is learning individual candlestick patterns in detail. In the upcoming articles in this series, we will cover the Doji, the Hammer, the Shooting Star, the Engulfing patterns, and many more — each with clear explanations and real crypto chart examples.
Bookmark this guide and come back to it whenever you need a refresher. And if you are completely new to crypto, make sure to check out our Beginners section, where we explain everything from what cryptocurrency is to how to buy your first Bitcoin safely.
Disclaimer: This article is for educational purposes only. It does not constitute financial or investment advice. Always do your own research before making any financial decisions.